


Dividend Policy and Payout Ratio Explained

Dividend Policy Explained
A company’s dividend policy tells investors the policy the company’s management has in place regarding the total amount of dividends paid out by the company to its shareholders and how often these are paid. Dividends paid by a company are a big factor in keeping the share price of the company stable. The dilemma with the dividend policy is the difficulty to find the right balance between being too conservative or too aggressive.
Throughout time it has been seen that companies that increase their dividends, even if it is by a very small percentage, their share price will increase with it. If the dividend remains the same for a number of years, the increase in share price will need to be driven by a different factor.
Companies can take various stances when it comes to dividend policy. A company can have a conservative policy, and amass cash reserves strengthening its balance sheet. A company could also have an aggressive dividend policy, this keeps the shareholders of the company happy, but the company will have a tougher time reinforcing its balance sheet. Finally, there could be a balanced dividend policy, where a company can commit a certain percentage of profits to dividends. Many companies take this stance, this is done in order to not overcommit their resources in case of a difficult year.
It is important to note that when there is a crisis like a pandemic, a financial crisis, a war, etc. even the most conservative companies will take into consideration cutting dividends, either by a high percentage or totally to retain more resources. For example, during the Covid-19 pandemic, many companies decided to cut their dividends either by a significant amount or completely.
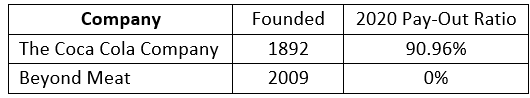
The table below shows examples of different companies in different industries before and after the Covid-19 pandemic. The table shows how these 4 companies each in a different industry had their dividends reduced to $0 or almost $0 because of the crisis.

As can be seen from the table above, all these companies made the decision to cut dividends during the Covid-19 pandemic in order to prevent cash outflows and retain as much of their resources in their balance sheets as possible.
It is not all about the dividends!
Berkshire Hathaway, the company owned and run by Warren Buffet is considered one of the safest companies in the world. This company usually holds on to all the profits the company makes and has never paid dividends. They have an extremely safe balance sheet usually with excess cash and very little to no debt. Not only is this company very safe but it has also produced an overall gain of 2,404,748% from 1964 to 2017.
This drives the question: How conservative or aggressive should a company be when it comes to its dividend policy? There is no real right answer, in the end, each company must find the right balance.
Dividend Payout Ratio Explained
Now that you have a better understanding of the dividend policy, it is time to understand one of the most popular financial ratios used: “The Dividend Payout Ratio”. The dividend payout ratio tells an investor the percentage of profits (net income) a company pays out to its shareholders.
To have a better understanding of this we will take as an example Carnival Corporation and Royal Caribbean 2019 dividend payout ratio. Remember this was before the Covid-19 pandemic. Things look much different for these companies nowadays.

As explained earlier the dividend payout ratio is a financial metric that shows the percentage of the yearly profits a company pays out to its shareholders through dividends. The total amount of dividends paid by a company is found in the cash flow statement. From this example, in 2019 Carnival Corp. paid 46.4% of the profits earned to its shareholders. This means that the company paid out $1.4 billion in dividends from the $3 billion earned in profits during the year. On the other hand, Royal Caribbean paid $600 million to its shareholders through dividends from the $1.9 billion earned in profits during 2019. This equates to a dividend payout ratio of 32.1% for that given year.
It is important to understand the dividend payout ratio as it also shows what percentage of the company’s profits are being retained, meaning being kept in the company’s balance sheet. Many companies decide to retain the majority of their earnings in order to reinvest in future growth, fund operations, pay off debts, add to cash reserves, etc. The dividend payout ratio will also depend on the growth stage of a given company. More mature companies will usually pay a higher percentage of their earnings to their shareholders. Coming back to the example, it can be seen Carnival Corporation retained $1.6 billion of the profits it earned during 2019 while Royal Caribbean retained $1.3 billion.
Now, the dividend payout ratio will not tell you much about a company’s health, future investment plans, etc. However, it can give you an idea of how mature or young a company is. A mature company usually pays a higher dividend because for mature companies the growth opportunities are limited. On the other hand, a younger company will probably have a lower dividend payout ratio as it has more growth opportunities. For this reason, younger companies retain most of their profits to reinvest and continue growing their operations.
Current Real-World Examples of the Dividend Policy and Dividend Payout Ratio
As mentioned earlier many companies opt for a given dividend payout ratio every year. For example, Euronext NV and Heineken managements have a certain dividend payout ratio. Euronext NV's dividend payout ratio stands at 50% of its yearly earnings, while Heineken has a policy of having a dividend payout ratio between 30% to 40% of yearly earnings.
Euronext NV Example:

Heineken Example:

This is a conservative approach taken by companies to not overcommit during difficult years. In contrast to this, the Kraft Heinz Company has a dividend policy of $1.60 per share per year. This means the company will try its best to pay this amount to shareholders regardless of if it was a good or bad year. This is a more aggressive dividend policy as during bad years the company could see the dividend payout ratio above 100%. When a company has a dividend payout ratio above 100% it theoretically means that the company is returning more money to its shareholders than the company is currently earning. This means that a dividend payout ratio above 100% is considered a red flag.
The Kraft Heinz Company Example:
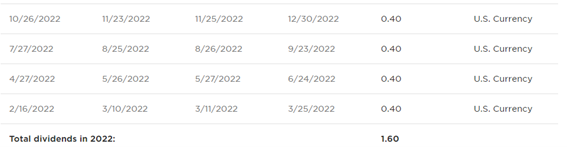
The $1.60 dividend per share amounts to a total of $1.96 billion paid in dividends on a yearly basis. In this case, it does not matter what the net income for the year is, the company will do its best to pay the dividends to the shareholders. As such for the Kraft Heinz Company during 2022 the dividend payout ratio amounted to 83% as the company reported a net income of $2.4 billion for 2022 (Please refer to the last table in the article). However, if we take the same example but take the numbers for 2021, we can see that the dividend payout ratio amounted to 194%, as the company reported a net income of $1 billion in 2021 while the total dividend payments totaled $1.96 billion. More on these below.
Sustainability of Dividends
Now that we have gone through what is a dividend policy and the dividend payout ratio, the time has come to understand how to analyze the sustainability of the dividends a company is paying. This can help understand if a company will run into trouble and not be able to pay dividends, if investors can expect dividend increases through the years, or if investors can simply expect a constant dividend from a company.
To truly understand the sustainability of dividend payments by a company we need to look at the yearly free cash flow of the company. What is free cash flow? Free cash flow is the cash the company can retain after paying for its capital expenditures.
Free Cash Flow formula: Cash Flow from Operations – Capital Expenditures = Free Cash Flow
We will write articles for both free cash flow and capital expenditures during the next couple of months, but for now, just understand that “Capital Expenditures” is the money invested by a company to maintain and grow its operations. This money is used to buy and maintain long-term machinery, property, software and/or plants, etc. which are needed to operate the business and generate revenues. Once these investments have been done, the remaining cash is considered the free cash flow, which the company can use to pay dividends, pay down debt, retain as cash, etc.
We will take 2 examples, one based on a dividend payout ratio of 50% and one based on a fixed dividend per share. The examples are based on Euronext NV and The Kraft Heinz Company.
Euronext NV Example:
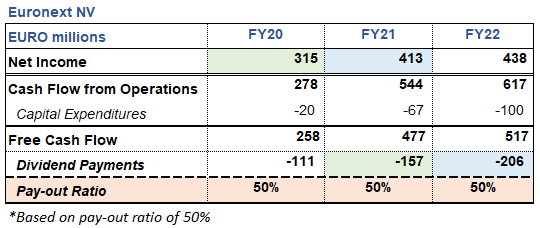
As previously noted, Euronext has a dividend policy of paying 50% of its yearly earnings. In the table below we have color coded the earnings and dividends. The colors concern to a net income from a given year and dividends paid from that specific year’s net income. As can be seen, dividends are paid the following year the net income is recorded. So for example, in 2020 Euronext reported a net income of EUR 315 million, so in 2021 the company paid 50% of this amount which totaled EUR 157 million. The same happened in 2021, Euronext reported a net income of EUR 413 million, as such in 2022 the company paid 50% of this amount which totaled EUR 206 million.
To understand how sustainable these dividend payments are, we have to take a look at the free cash flow the company generated during these years. From the table below it is clear that the free cash flow generated comfortably covered the dividend payments. For Euronext shareholders, this is a great scenario as the company is increasing dividends on a yearly basis and there is still enough cash to retain in the balance sheet, pay down debt, etc.
An investor should worry if the free cash flow was not able to cover dividends, this is because if the free cash flow is not able to cover dividends, then the company would have to borrow funds or use its cash in order to make the dividend payments. Now, this is fine if it happens one year or very sporadically, however, if it is happening multiple years in a row, then as investors we should analyze if dividends will need to be cut or if the company will be able to generate enough free cash flow during the next years to cover dividends.
The Kraft Heinz Company Example:
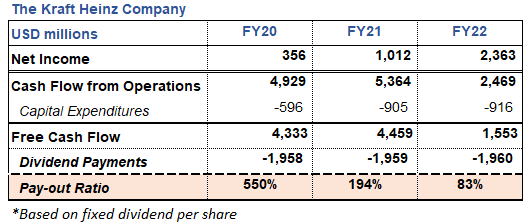
Looking at the Kraft Heinz Company, the situation is very different. The company has a dividend policy of paying $1.60 per share, which equates to $1.96 billion in dividend payments each year. As such the payout ratio will fluctuate depending on the net income reported each year. As can be seen from the table below, the company has payout ratios ranging from 550% in 2020 to 83% in 2022. Readers could be asking how can this company keep paying dividends or how is it that they have not cut dividends? Well, here is why the free cash flow is so important. In this example, net income is clearly not sufficient to cover dividends, nonetheless, the free cash flow reported by the company is more than sufficient during most years. For example, in 2020 and 2021 the Kraft Heinz Company reported free cash flows of $4.3 billion and $4.6 billion, respectively. These free cash flows covered the dividend payments quite comfortably.
Here we can see why it is important to understand not only the dividend policy and the dividend payout ratio but also the free cash flow generated by the company. This is a great example to see because even though the payout ratio during 2020 and 2021 was clearly above 100% which would send red flags to all investors, the company was able to pay dividends without much difficulty because of its robust free cash flow. Then looking at 2022, the payout ratio was clearly below 100% but the free cash flow was not sufficient to cover dividend payments. As such the company needed to use the cash in its balance sheet to cover dividends. This is why it is so important to understand each financial metric not only theoretically, but also in the real world.
With these examples, investors should realize that just by looking at financial metrics we are not able to have a clear picture of how a company is performing. Instead, financial metrics are tools for investors to better understand the financial situation of a company.
Disclaimer
The information provided in this article is for informational and educational purposes only and should not be construed as financial or investment advice. The content of this article is based on the authors' personal opinions and research, and it may not be appropriate for your specific investment goals, financial situation, or risk tolerance. Any investment decision you make should be based on your own research and analysis, and you should consult with a qualified financial advisor before making any investment decisions. The author of this article assumes no responsibility or liability for any investment losses or damages that may result from your reliance on the information provided herein.