


Understanding Free Cash Flow: A Comprehensive Guide for Investors

Free Cash Flow (“FCF”) is the metric that is considered the lifeblood of a company. In this article, we will explore what Free Cash Flow is and why is it so important.
Imagine a company as a big jar. Every time the company sells a product or service, cash enters this jar. In the same way, every time the company pays its bills or invests in new assets, cash leaves the jar. The money left in the jar at the end of a specific period is the company's Free Cash Flow.
Free Cash Flow vs. Net Income
While both FCF and net income provide insights into a company's financial health, they are not synonymous. Earnings (or net income) are an accounting measure, whereas FCF offers a tangible look at the actual cash flow. Hence, FCF is often deemed a more reliable metric, less susceptible to manipulation.
Formula to Keep in Mind:
Free Cash Flow = Operating Cash Flow - Capital Expenditures
Where:
Operating Cash Flow: represents the cash generated from the company's core business operations. It is calculated as:
Operating Cash Flow = Operating Income + Non-Cash Changes - Changes in Working Capital – Taxes
CAPEX (“Capital Expenditures”) denotes the money a company spends on physical assets. It is the sum of changes in Property, Plant, and Equipment (“PPE”) and depreciation.
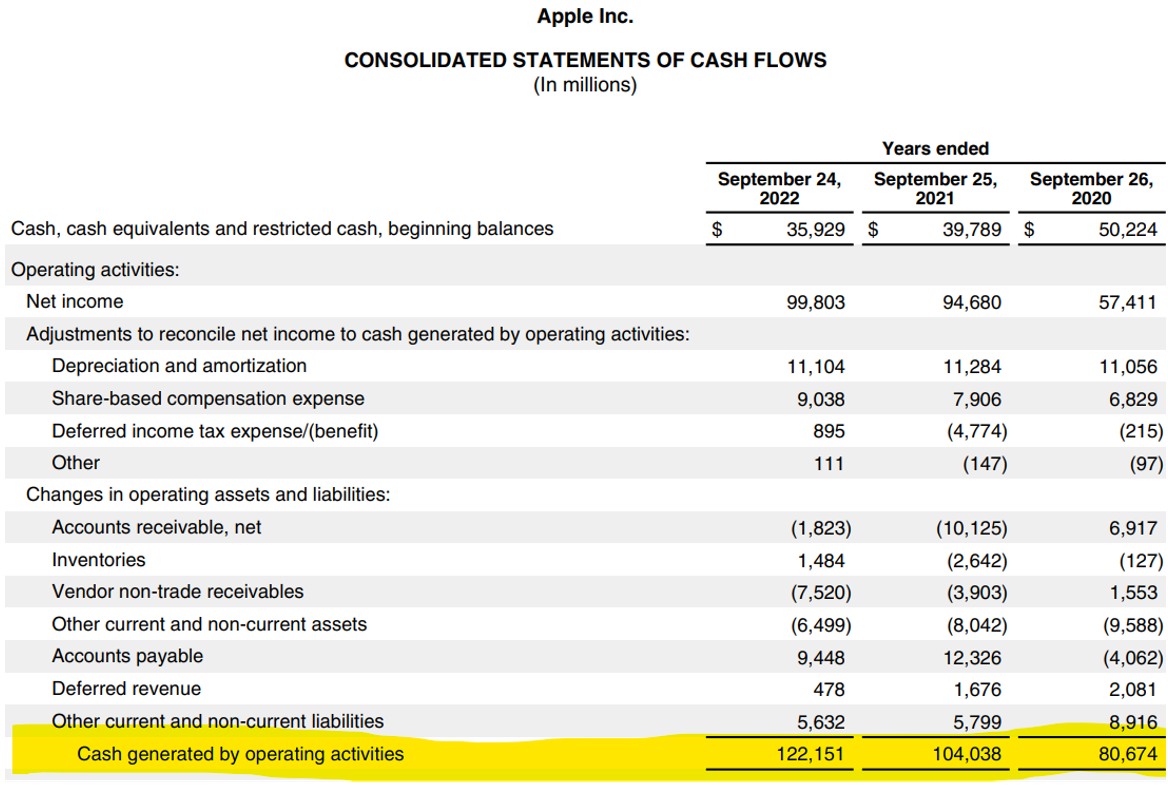
Let’s now take a look at a real-life example. Below you can see Apple’s 2022 cash flow statement. We have highlighted the cash flow generated from operations during the previous 3 years. As it can be seen Apple has been able to increase its cash generated from operations from $80.6 billion in 2020 to $122.2 billion at the end of fiscal year 2022. Remember that this is cash coming into the company.
Let’s now take a look at capital expenditures, which are the investments the company needs to make in order to sustain its business. These are investments in property, plant, and equipment. As can be seen in the picture below, Apple increased capital expenditures from $7.3 billion in 2020 to $10.7 billion at the end of the fiscal year 2022.
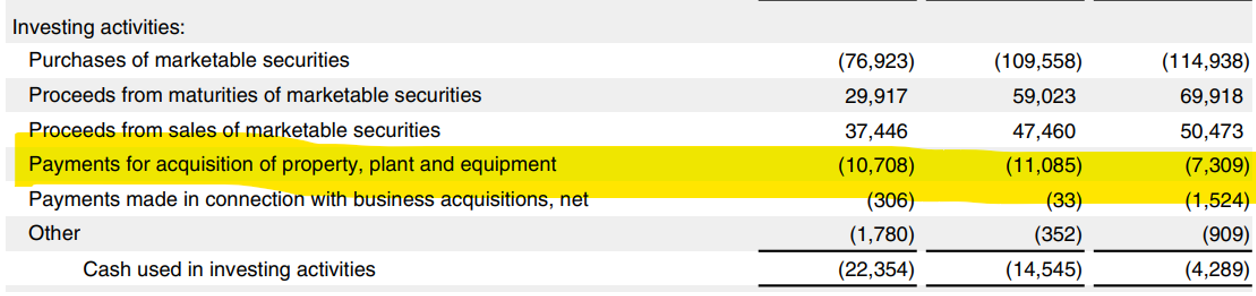
With this information, we can formulate Apple’s free cash flow for 2022. With cash flow from operations of $122.2 billion and capital expenditures of $10.7 billion, Apple generated a free cash flow of $111.4 billion in 2022.
Maintenance vs. Growth CAPEX
Capital expenditures can be broken down into two different items:
Maintenance CAPEX: Investments made to maintain existing assets.
Growth CAPEX: Investments in new assets to accelerate growth.
A surge in growth CAPEX can lead to a dip in FCF, indicating a company's heavy investment in its future. However, if these investments add significant value, they can be very valuable in the long run.
We will discuss the Maintenance and Growth of Capex to a greater extent in a future article.
The Power of Free Cash Flow
With a positive FCF, a company has various options for capital deployment, such as:
Reinvest for organic growth.
Pay down debt.
Engage in mergers and acquisitions (“M&A”).
Distribute dividends.
Buy back shares.
The way a company allocates its FCF can provide insights into the management's strategy and efficiency. Typically, reinvesting for organic growth is the most favored approach, however for mature companies buying back shares, paying down debt, distributing dividends, or engaging in inorganic growth through M&A are also viable options.
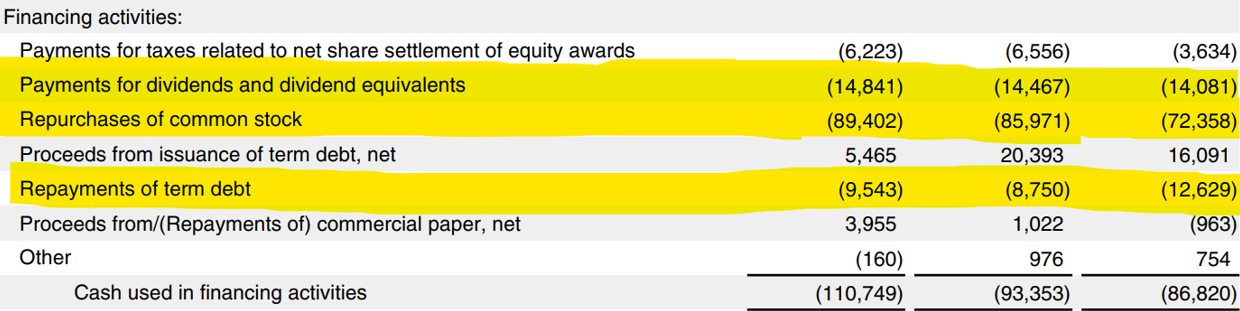
Going back to Apple’s example, we can see that during 2022 management decided to deploy most of the capital in three items. The repayment of debt amounting to $9.5 billion, the payment of dividends for a total of $14.8 billion, and finally the huge share repurchases totaling $89.4 billion. As such management effectively used all of the free cash flow generated ($111.4 billion) throughout the year to return value to shareholders and debtholders.
FCF Conversion and FCF Margin
Let's examine other key metrics that free cash flow reveals. These metrics help investors understand the efficiency of the company in keeping the generated cash and also provide insights into its profitability.
FCF Conversion
A company's ability to convert operating cash flow into free cash flow is a testament to its efficiency. The FCF conversion ratio can be calculated as:
FCF Conversion = (Free Cash Flow / Operating Cash Flow)
FCF Margin: A Measure of Profitability
The FCF margin is a strong metric for understanding a company's profitability. It essentially indicates the cash generated per dollar of sales:
FCF Margin = (Free Cash Flow / Sales)
Let’s take a look at companies in different sectors to understand the different cash flow profiles companies have when it comes to Free Cash Flow.
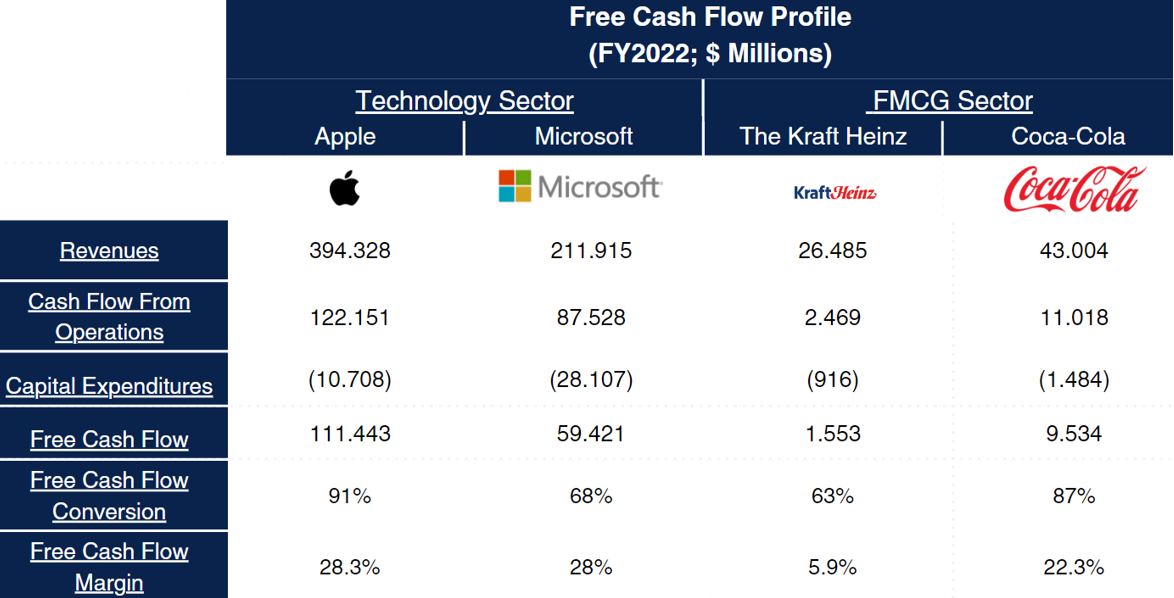
As can be seen, the Technology sector has very strong free cash flow conversions as once these companies scale, the cost of generating higher sales is minimal. We can also take a look at Coca-Cola, a company that has scaled to be one of the biggest FMCG companies in the world with a global footprint. Finally, Kraft Heinz, which is big but not worldwide as Coca-Cola as such its free cash flow conversion has not been optimized to the highest levels.
We can see a similar scenario when it comes to free cash flow margin. For instance, Apple, Microsoft, and Coca-Cola all generate impressive FCF margins above 20%. This means that for every $100 in sales, these companies generate more than $20 in pure cash. This is quite different from Kraft Heinz, with a modest FCF margin of 5.9%.
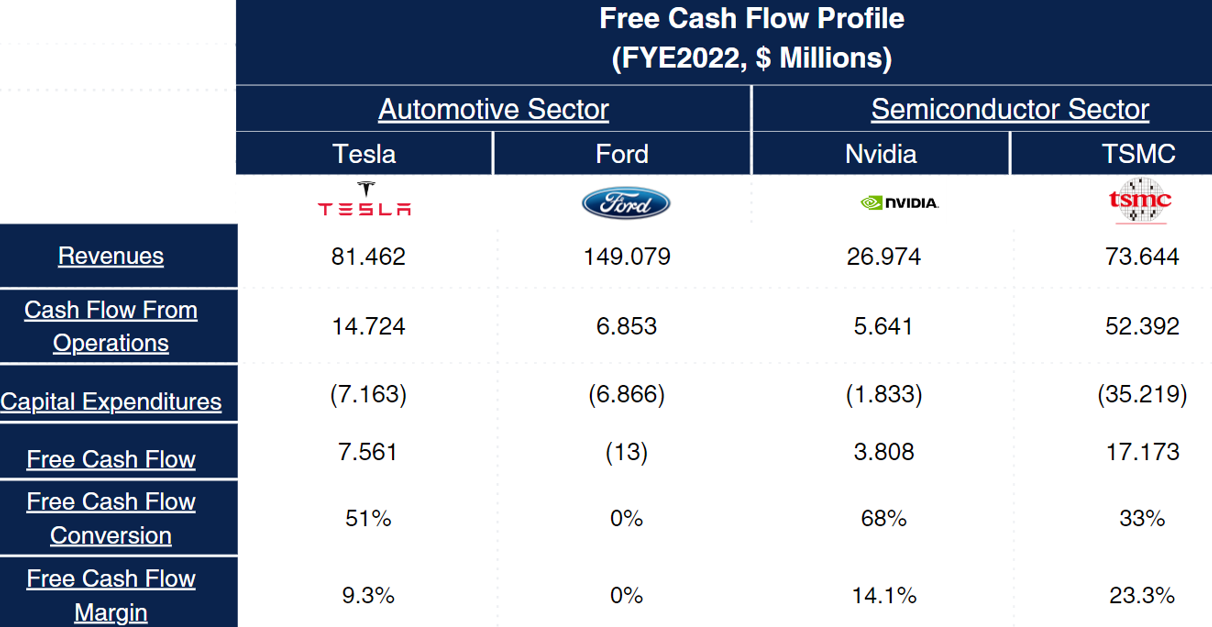
Let’s now see what happens with companies that are capital-intensive. Meaning they need to invest heavily in property, plant, and equipment (“PP&E”) and have lower margins. The Automotive sector is great for this example. Given automotive companies need plants in order to build cars, these companies need to invest heavily in their PP&E. Tesla for example had to invest about 50% of its cash generated in capital expenditures. At the same time, Ford had to invest all of its cash flow from operations into capital expenditures, leaving no money for dividends, share buybacks, etc. As such if Ford wanted to deploy capital, it had to do it with its cash reserves from its balance sheet.
Finally, let’s take a look at the semiconductor sector. This sector has players with different business models. Nvidia for example does not have a capital-intensive business model as it does not have a fabrication plant. On the other hand, TSMC does have fabrication plants around the world, as such it has a capital-intensive business model. Saying this TSMC has a very high profit margin of over 40%, which allows the company to generate FCF margin of 23.3%.
Stock-Based Compensation: A Careful Consideration
For investors, stock-based compensations can be a double-edged sword. While they can incentivize employees, they also dilute the value for existing shareholders. Therefore, in some cases, it's prudent to consider FCF after excluding stock-based compensations for a more conservative view.
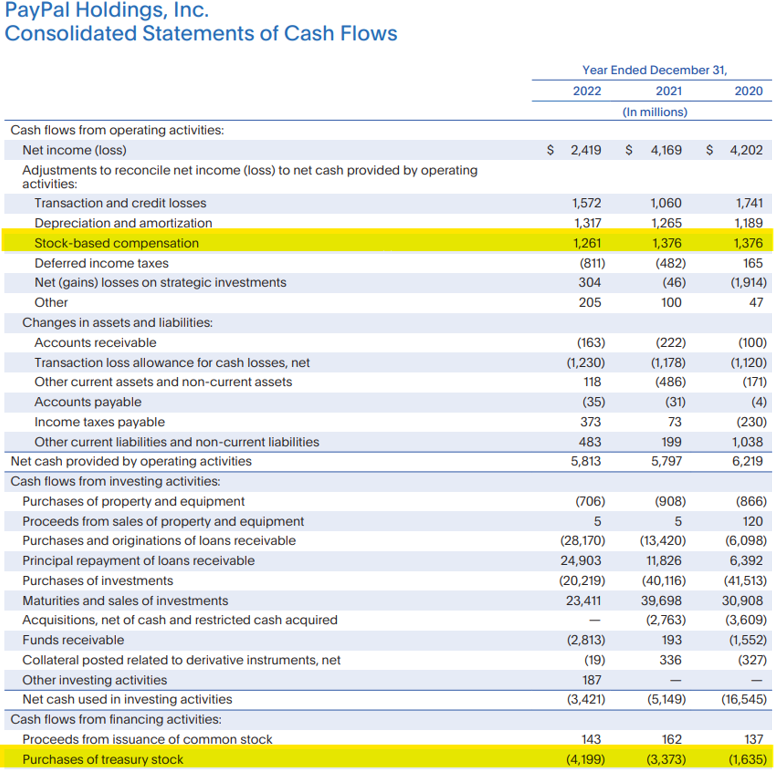
As an example, let’s take a look at PayPal’s cash flow statement. As it can be seen the company had an expenditure of approx. $1.3 billion in stock compensation. Given this is not a cash expenditure it gets added back into operating cash flow. Remember stock compensation means, employees are receiving shares and NOT cash. However, given the company is spreading around $1.3 billion worth of shares, existing shareholders get diluted. The way the company redeems these shares is by doing stock buybacks. We always want to see the stock buyback amount being higher than the stock compensation amount as that would mean more shares are being redeemed than awarded.
Conclusion
Free Cash Flow is a vital metric indicating a company's financial health by showing the actual cash remaining after operational costs and investments. It’s important to understand that different sectors have different free cash flow profiles. For example, while technology companies often have robust free cash flow due to scalability, capital-intensive sectors, like automotive, face more constraints. Additionally, investors should take note of stock-based compensation as it dilutes existing shareholders’ value. In essence, FCF provides a clear insight into a company's efficiency and profitability while the use of the FCF gives a good overview regarding capital allocation choices.
Disclaimer
The information provided in this article is for informational and educational purposes only and should not be construed as financial or investment advice. The content of this article is based on the authors' personal opinions and research, and it may not be appropriate for your specific investment goals, financial situation, or risk tolerance. Any investment decision you make should be based on your own research and analysis, and you should consult with a qualified financial advisor before making any investment decisions. The author of this article assumes no responsibility or liability for any investment losses or damages that may result from your reliance on the information provided herein.